
RFM Segmentation Using Bigquery: Part 1
This series will walk you through how to use customer data effectively, starting with the basics of RFM segmentation and culminating in activating data.
Segmenting GA4 data in BigQuery using RFM model for Personalized Marketing
Understanding customer behavior is crucial for creating personalized marketing campaigns that drive engagement and loyalty.
As part of our Data Activation Series, this post is the first in a three-part guide that will help you transform raw data into actionable insights for driving personalized marketing strategies. This series will walk you through how to use customer data effectively, starting with the basics of RFM segmentation and culminating in activating that data within Google Ads for highly targeted campaigns.
In this first post, we’ll focus on how to build an RFM (Recency, Frequency, Monetary) model using GA4 data in BigQuery. The second post will dive into how to enhance this segmentation using K-means clustering, a machine-learning technique that can uncover more nuanced customer segments. Finally, the third post will cover how to activate this segmented data in Google Ads, allowing you to create tailored advertising campaigns that maximize customer value and marketing ROI.
Let’s start by walking through the process of creating an RFM table and using these insights to better understand and engage with your customers.
Understanding RFM
The RFM (Recency, Frequency, Monetary) model is a widely used framework in marketing for evaluating customer behavior. It focuses on three key metrics:
- Recency: How recently a customer made the last purchase
- Frequency: How often a customer makes purchases
- Monetary: How much a customer spends in total
By analyzing these metrics, businesses can gain valuable insights into customer loyalty, engagement, and potential value. For instance, customers who score high in all three dimensions are typically the most valuable, while those with lower scores may need re-engagement strategies.
Creating RFM table
- Data Preparation
The first thing we need to do is to prepare our RFM table. We typically need these fields from our analytics table:
event_dateuser_pseudo_id or user_idecommerce.transaction_idecommerce.purchase_revenue
Below is an example query to structure the relevant data for building the RFM model:
with transactions as(
 select
      event_date,
      user_pseudo_id,
      ecommerce.transaction_id as transaction_id,
      ecommerce.purchase_revenue as purchase_revenue
 from
   `project.dataset.table`
 where event_name = "purchase" )
- Calculate RFM Metrics
Now, we calculate the Recency, Frequency, and Monetary metrics using additional common table expressions (CTEs).
Recency: Calculated as the difference between the current date and the date of the last transaction for each user. A higher number indicates lapsed customers who may need re-engagement.
Frequency: The total number of transactions a user has had during a given period, indicating how loyal the customer is.
Monetization: The sum of the revenue generated by all the user’s transactions, which helps to rank your most valuable customers.
Here’s a query that computes these metrics:
,rfm as (
   select
     user_pseudo_id,
     date_diff(current_date(),
       max(parse_date('%Y%m%d', event_date)), day) as recency,
     count(distinct transaction_id) as frequency,
     sum(purchase_revenue) as monetary
   from transactions
   group by user_pseudo_id ),
- Build RFM table
Now, we can combine the transactions and RFM metrics into a complete RFM table:
with transactions as (
 select
   *
 from
   `project.dataset.table`
 where event_name = 'purchase' )

 ,rfm as (
   select
     user_pseudo_id,
     date_diff(current_date(),
       max(parse_date('%Y%m%d', event_date)), day) as recency,
     count(distinct ecommerce.transaction_id ) as frequency,
     sum(ecommerce.purchase_revenue) as monetary
   from transactions
   group by user_pseudo_id )

select
 *
from
 rfm
The code above has been slightly refactored to optimize readability and processing efficiency.
- Create RFM Segments
After creating the RFM table, the next step is to segment your customers into distinct groups for more effective targeting. One common method is using the NTILE function in BigQuery, which allows you to divide your customers into equal-sized buckets based on their RFM scores.
NTILE distributes the data into a specified number of segments, making it a powerful tool for categorizing customers into tiers like top 20%, bottom 20%, and so on. This segmentation makes it easy to identify high-value customers, frequent shoppers, or those needing re-engagement. For example, you can use NTILE to divide customers into quintiles (5 segments) for each RFM metric, allowing you to personalize your marketing strategy effectively.
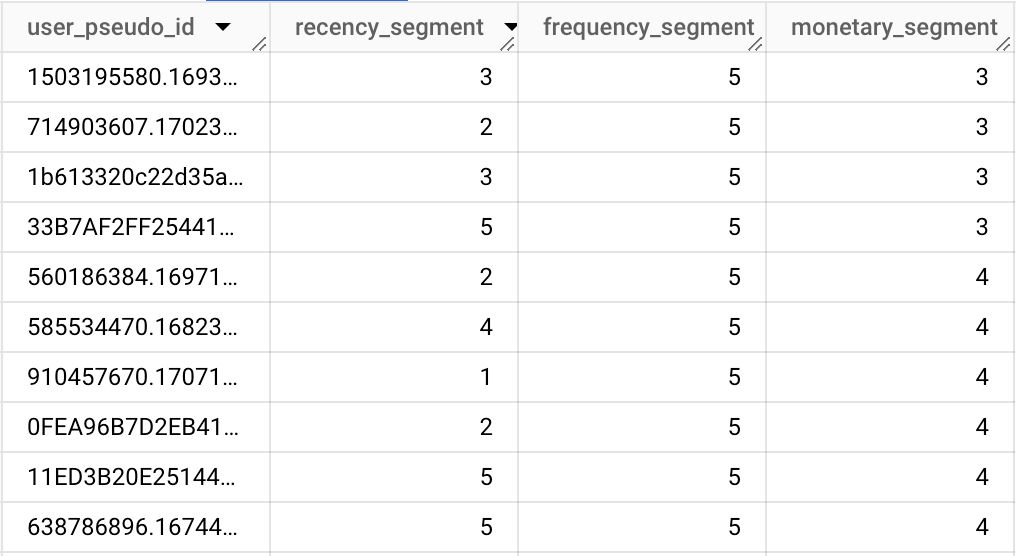
Below is a query using NTILE to divide customers into 5 segments:
select
 user_pseudo_id,
 NTILE(5) OVER (ORDER BY recency DESC) as recency_segment,
 NTILE(5) OVER (ORDER BY frequency DESC) as frequency_segment,
 NTILE(5) OVER (ORDER BY monetary DESC) as monetary_segment
from
 rfm

 where event_name = "purchase"
In this example, customers are ranked into 5 segments (quintiles) based on Recency (more recent transactions rank higher), Frequency (more transactions within a period rank higher), and Monetary (higher spending rank higher). This segmentation will allow you to easily identify which customers fall into your top or bottom segments for each metric, helping you craft more personalized marketing strategies.
Summary and Challenges
In this post, we’ve explored how to leverage GA4 data in BigQuery to create an RFM table for personalized marketing. We walked through the process of preparing and structuring your transactional data, calculating the RFM metrics (Recency, Frequency, and Monetary), and building a complete RFM table. Finally, we demonstrated how to segment your customers using the NTILE function, creating distinct customer groups for more targeted marketing strategies.
While the RFM model and NTILE provide a straightforward way to classify customers based on their purchase behavior, there are some challenges with this approach. The primary limitation of NTILE is its simplistic method of segmenting customers solely by rank, without accounting for variations in the distribution of the data. This can result in customers with very different behaviors being grouped together in the same segment.
For example, RFM metrics are treated independently, without considering how Recency, Frequency, and Monetary interact. A customer who shops frequently but spends little might be placed in a similar segment as a customer who spends a lot but purchases infrequently, despite their differences. This lack of nuance can lead to less effective personalization and targeting.
In the next post, we’ll tackle these challenges by introducing K-means clustering, a machine learning technique that enables more precise segmentation by identifying more natural groupings within your RFM data.