
Incrementality Testing
Incrementality testing is a statistical method used to determine the impact of a specific marketing or advertising campaign on the performance of a business.
What is incrementality testing?
Incrementality testing is a statistical method used to determine the impact of a specific marketing or advertising campaign on the performance of a business. The goal of an incrementality test is to optimize marketing spending by identifying the most, or least, effective campaigns. This is done by understanding the “incremental impact” of each campaign.
In this post, I will walk you through an incrementality test we recently performed for one of our clients.
The questions and hypothesis
At the start of any statistical test, you will need to set up a null hypothesis, which you want to invalidate, and an alternative hypothesis, which you want to validate. Note that invalidating the null hypothesis does not automatically validate the alternative hypothesis.
Our client approached us with the question of whether or not one of their marketing campaigns had any impact on sales. The null hypothesis, in this case, would be H0; Stopping the Google Generic Search Ads campaign will not have any effect on the sales for the company.
First, we needed to invalidate this hypothesis. We defined a control group and a treatment group to perform our incrementality test. The members of each group must be as similar as possible to determine that any observed differences in performance are due to the campaign and not due to any difference between the groups. This particular test was conducted in the city of Gothenburg, Sweden.
The control group represents the period before the test when the Google Ads Generic campaign was active, and the treatment group represents the period during the test when the campaign was stopped. This ensures similar populations since both groups are targeted with ads in the same way.
The experiment
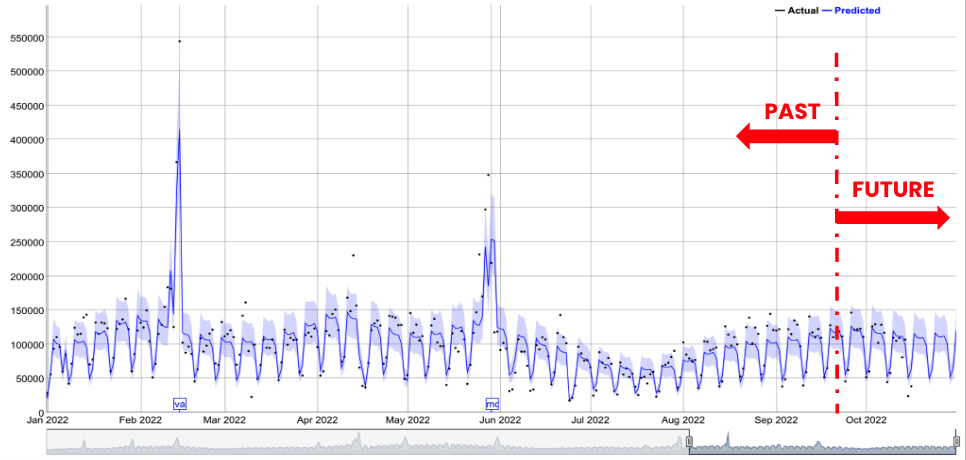
To perform the test, we created a forecast two weeks into the future where we imagine nothing changes, and the control group simply extends into the future. Once the forecast was created, we compared the forecasted values against the actual values that we observed during these two weeks. The forecast was built on a model created by a tool called Prophet, which is created by Facebook, an open-source software that makes it easy to create high-quality forecasts.
Evaluation
When evaluating the results it is important to ensure that the outcome of the test is statistically significant. This means that the difference between the forecasted values and the actual values observed during the test period cannot be explained by chance alone. Without a statistically significant outcome, we cannot be sure that the difference is real and not just a fluke.
To determine whether or not the outcome was statistically significant, we used a process called causal inference. Causal inference is the process of determining whether the relationship between two variables is “causal”, or whether the relationship is due to some other known, or unknown factors. We tested this with the help of a package called CausalImpact in R, developed by Google.
From the results of the test, we could determine with help of the p-value, the accuracy of the forecast. The p-value is a measure of the probability that the observed difference between the forecasted and actual values is due to chance. If the p-value is below a certain threshold, which is typically 0.05, then the outcome is considered to be statistically significant and the difference between the values is considered to be real and meaningful.
Results
The statistically significant results enabled us to evaluate sales of the treatment group. If the sales during the two-week test period were lower than the 95% confidence interval of our forecast we would be able to support our alternative hypothesis H1; that stopping the campaign had an adverse effect on the sales.
During the test period, we expected the sales to be about 30% higher than the actual outcome. This gap equates to incremental revenue.
The incremental Return On Ad Spend (iROAS) is a measure of the return on investment (ROI) of a marketing campaign. It is calculated by dividing the incremental revenue generated by the campaign by the cost of the campaign. The results of the test concluded that the iROAS for this specific campaign amounted to 720% which was substantially above their break-even point of ~300%.
Conclusion
Based on these results, we inferred that the marketing campaign was effective at driving additional sales for the company. The high iROAS indicated that the campaign generated a good return on investment, and was a worthwhile investment for the company. What we established was that we could recommend the client to continue their existing spend on this campaign in the future, and even consider expanding the spending to drive even more sales somewhere closer to their break-even point.
Appendix
The model
The statistical model that built the forecast, as previously mentioned, is called Facebook Prophet. The Facebook Prophet is an additive regression model, which is a type of statistical model that is used to forecast time series data. The word “additive” assumes that the various factors that influence the time series can be added together to produce the final forecast. In other words, the model assumed that the effects of each factor are independent of each other.
Extra verifier
We also used Stockholm as a second city, an extra verifier when we conducted the test, this helped to improve the reliability and validity of the results. By comparing the results in the two different cities, where spending has a similar relationship to sales, we could control for extraneous variables that may act on the results.
Mathematical model
The mathematical model can be written as follows:
y(t) = g(t) + s(t) + h(t) + ε(t)
Where y(t) is the value of the time series at time t, g(t) is the trend component of the forecast, s(t) is the seasonality component of the forecast, h(t) is the holiday component of the forecast, and ε(t) is the error term.
The trend component g(t) is modeled using a piecewise linear function, which allows the trend of the time series to change over time. The seasonality component s(t) is modeled using a Fourier series, which allows for periodic patterns in the time series data. The holiday component h(t) allows the model to account for the effects of specific, and sporadic holidays on the time series. And the error term ε(t) accounts for any random noise or variability in the time series that is not explained by the other components of the model.
Assumptions (for the super nerdy)
Some assumptions that we made, and also confirm before using this model are:
- That there is a linear and additive relationship between the dependent variable (the sales) and the independent variable (the campaign budget).
- That there is no correlation between the residual (error) terms. The absence of this phenomenon is known as autocorrelation.
- If there is more than one independent variable - they should not be correlated. This is known as multicollinearity. (in our case this is not checked for since we only have one independent variable)
- That the error terms must have constant variance, which is known as homoskedasticity. The presence of non-constant variance is referred to as heteroskedasticity.
- And lastly, the error terms must be normally distributed.
Once all of these assumptions are met, we can continue to use the model and draw conclusions from its results.