Building a Marketing Data Warehouse in BigQuery

Marketers today are swimming in data. From ad platforms and web analytics to CRM systems and email campaigns, the sheer volume can be overwhelming to get a control of. The real challenge? This valuable data often lives in silos, making it incredibly difficult to get a unified view of your marketing efforts, understand the full customer journey, or make truly data-driven decisions.
Sound familiar? You spend hours manually pulling reports, wrestling with spreadsheets, and struggling to connect the dots between your various ad spends and your actual sales conversions. There’s a better way: building a Marketing Data Warehouse (MDW).
This post will guide you through the why and how of creating your own MDW using Google BigQuery, a powerful cloud data warehouse, and leveraging data integration tools to simplify the process.
What Exactly is a Marketing Data Warehouse?
Think of an MDW as your single source of truth for all marketing data. It’s a centralized, unified destination where you can store, organize, and analyze information from all your different marketing channels and platforms. Unlike scattered spreadsheet files or basic reporting dashboards within individual tools, a data warehouse is designed for deep analysis and integrating disparate information sources.
Data Lake vs. Data Warehouse & The Role of ETL
You might hear terms like “Data Lake” and “Data Warehouse.” What’s the difference for a marketer?
- Raw Data: Imagine all your individual spreadsheets, CSV exports, and platform reports scattered across drives and folders. This is data in its most basic, often unprocessed, state.
- Data Lake: Think of a central storage repository, like a large digital pond, where you dump all this raw data, often unstructured or semi-structured, without much upfront organization. It’s all collected in one place, which is a start, but it’s not necessarily ready for easy analysis or reporting. Finding what you need can be like searching through murky water.
- Data Warehouse: This is where the magic happens for analysis and reporting. A data warehouse stores data in a highly structured, optimized format, making it easy to query and understand. Data moved into a warehouse has typically been cleaned, standardized, and organized. You’ll usually find well-defined tables for specific areas like advertising performance, website analytics, customer data, etc., all ready for generating insights.
So, how does data get from its raw state or the data lake into this clean, organized data warehouse? This is often achieved through a process called ETL, which stands for Extract, Transform, Load. For someone new to the term, think of it like preparing ingredients for a complex recipe:
-
Extract: First, you gather (extract) the raw data ingredients from various sources – your ad platforms (Google Ads, Facebook Ads), your website analytics (Google Analytics), your CRM system, spreadsheets, etc.
-
Transform: Next, you prepare (transform) these ingredients. This is a crucial step where the raw data is cleaned up, standardized, and reshaped. For example, you might ensure date formats are consistent across all sources, convert currencies, rename campaign naming conventions to be uniform, calculate new metrics (like ROI), or filter out irrelevant information. This ensures the data is accurate, consistent, and ready for analysis.
-
Load: Finally, you put (load) the prepared, transformed data into its designated place in the data warehouse – into the structured tables designed to hold specific types of information (e.g., daily ad spend, website session details, customer purchase records).
While ETL is the classic sequence, sometimes the order changes slightly (like ELT – Extract, Load, Transform). It’s also important to note that modern cloud data warehouses, notably Google BigQuery, increasingly blur the lines between these steps by offering powerful, integrated tools to handle transformations directly within the warehouse itself. Services like Dataform (for managing complex SQL workflows, testing, and scheduling) or even simple Scheduled Queries allow teams to efficiently implement an ELT (Extract, Load, Transform) pattern. In this approach, raw or minimally processed data is first loaded into BigQuery (often into staging tables), and then sophisticated transformations are applied using these built-in tools to create the final, polished, analysis-ready datasets.
For many common marketing analytics use cases, this integrated transformation capability significantly reduces, and sometimes even eliminates, the need for maintaining a separate, dedicated Data Lake just for staging raw data prior to loading and transforming it within the warehouse.
Key Characteristics of a Modern MDW:
-
Connects Multiple Sources: Pulls data from ads, analytics, CRM, email platforms, and more, making integration possible.
-
Stores Historical Data: Overcomes platform limitations (some only keep data for 90 days!) allowing for long-term trend analysis and year-on-year comparisons. You own your data history.
-
Ensures Data Quality & Consistency: The transformation step in ETL/ELT provides a dedicated stage to enforce data standards for reliable reporting.
-
Accessible: Allows team members (with appropriate permissions) to easily access the unified data they need.
-
Fast Performance: Cloud data warehouses like BigQuery are designed for quick querying and data retrieval, even with large datasets.
Why Should Marketers Care About Building an MDW?
Moving beyond messy spreadsheets and siloed platform reports unlocks significant advantages that directly impact marketing effectiveness and efficiency:
Holistic Performance View: Finally, compare apples to apples! See how your campaigns on different ad networks perform side-by-side using consistent metrics defined during the transformation stage. Link ad spend directly to website behaviour captured by analytics and, ultimately, to conversions tracked in your CRM or e-commerce platform. Understand the true ROI across all your efforts.
Unlock Historical Insights: Many ad platforms purge detailed data after a few months or a year. An MDW lets you own your historical data indefinitely. Want to see how seasonality affected performance two years ago compared to last year? Need to benchmark current campaigns against past successes (or failures)? Your MDW holds the answers. This long-term view is invaluable for strategic planning.
Supercharge Your Reporting: Connect your MDW directly to visualization tools like Looker Studio (formerly Google Data Studio), Power BI, Tableau, or others. Build automated, comprehensive dashboards that pull data from all your integrated sources. This drastically reduces the countless hours spent manually downloading CSVs, copying/pasting data, and wrestling with spreadsheet formulas. It also minimizes the risk of human error inherent in manual reporting.
Enrich Business Intelligence (BI): Marketing data provides crucial context for overall business performance but is often isolated from broader company BI initiatives. An MDW makes it straightforward to share clean, reliable, and structured marketing performance data with central BI teams. This enriches their analyses with marketing funnel insights, campaign impacts, and customer acquisition costs, leading to a more complete picture of the business.
Activate Your Data: A data warehouse isn’t just for looking backward; it’s a powerful tool for driving future actions. Go beyond basic reporting to build sophisticated audience segments based on combined data points that live across different systems. For example:
Identify high-value website visitors who interacted with Campaign X but haven’t purchased in 60 days according to CRM data.
You can then export these precise segments and push them back to ad platforms for highly targeted retargeting, or to marketing automation tools for personalized email nurturing sequences, improving campaign efficiency and personalization.
“But Can’t I Just Import Data into Google Analytics?”
While platforms like Google Analytics allow some data import capabilities (like cost data for ads), they don’t offer the same level of flexibility, control, ownership, or analytical depth as a dedicated MDW. Think of it like cooking:
Google Analytics (with imports): It’s like a high-quality microwave meal or a pre-made baking mix. You can heat it up, maybe add a garnish or a few extra chocolate chips, but you’re fundamentally limited by the pre-defined structure and ingredients. You can’t easily combine it with ingredients from completely different meals or analyze the raw components in novel ways.
Marketing Data Warehouse: It’s like having a fully stocked professional kitchen pantry and refrigerator. You have all the raw, high-quality ingredients (your cleaned and organized data from ads, analytics, CRM, etc.) stored properly. You have the tools (SQL, BI software) to combine these ingredients in virtually limitless ways, following existing recipes (standard reports) or creating entirely new culinary masterpieces (custom analyses, complex audience segments, predictive models). You own the ingredients and have complete control over the final dish.
Choosing Your Foundation: Why Google BigQuery?
While several excellent cloud data warehouse options exist (like Amazon Redshift, Snowflake, Azure Synapse Analytics), Google BigQuery stands out as a popular and particularly powerful choice for marketers, especially those already leveraging the Google Marketing Platform or Google Cloud ecosystem.
Key Benefits of BigQuery:
- Seamless data Integration: BigQuery offers built-in, automated data transfers directly from key Google marketing platforms (like Google Ads, GA4, YouTube Analytics, Search Console) via the BigQuery Data Transfer Service. This eliminates the need to source, build, or maintain custom ETL pipelines for these crucial data streams, saving significant development time and ongoing effort.
| Category | Data Sources |
|---|---|
| Marketing Platforms | Google Ads, Google Analytics 4 , Google Ad Manager, Google Merchant Center , Google Play, Search Ads 360, Display & Video 360, Comparison Shopping Service, Campaign Manager, Facebook Ads, Salesforce Marketing Cloud, YouTube Channel, YouTube Content Owner |
| Other Data Platforms | Amazon S3, Azure Blob Storage, Cloud Storage (GCP), Amazon Redshift, Teradata, MySQL , Oracle , PostgreSQL |
| CRM & Business Applications | Salesforce , ServiceNow |
- Scalability & Performance: Built on Google’s infrastructure, BigQuery can effortlessly handle massive datasets (terabytes and petabytes) and execute complex analytical queries remarkably quickly. It scales automatically, so performance remains strong as your data grows.
- Serverless Architecture: This is a huge operational advantage. “Serverless” means Google manages all the underlying infrastructure, hardware, and software updates. You don’t need to provision servers, manage clusters, or worry about patching systems. You simply load your data and start querying, allowing your team to focus on analysis, not infrastructure management.
- Cost-Effective Model: BigQuery employs a “pay-as-you-go” pricing structure that is often very attractive. You primarily pay for the amount of data stored (which is typically very inexpensive per GB per month) and the amount of data processed by your queries (with a generous free tier each month, often covering the needs of smaller teams or initial development). This avoids large upfront investments often associated with traditional data warehousing.
- SQL-Based Interface: Queries in BigQuery are written using Standard SQL, a widely adopted and powerful language for data manipulation and analysis. While learning SQL requires some effort, it’s a valuable skill, and many resources are available. Basic SQL for common marketing queries is often relatively straightforward to pick up.
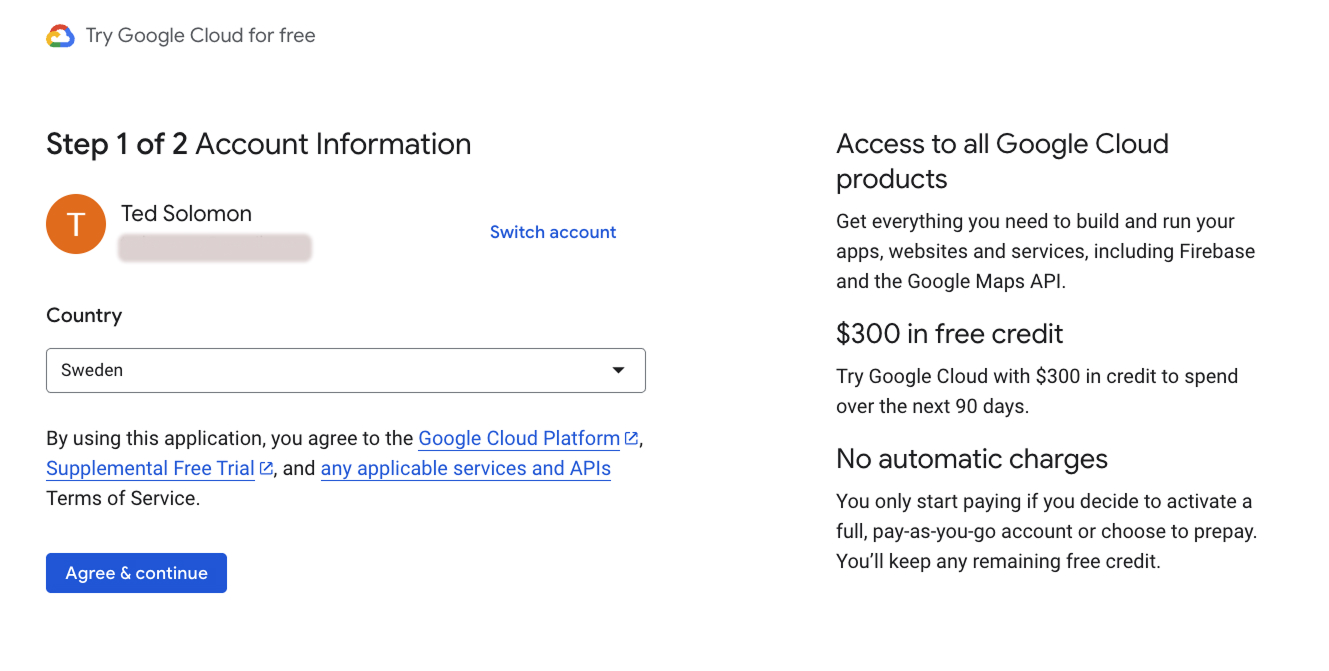
- Generous Free Tier & Sandbox: Google Cloud frequently offers substantial free credits for new users ($300 is common) to explore its services. Even more accessible is the BigQuery Sandbox. This allows anyone with a Google account to use BigQuery’s core features on a limited scale, explore public datasets, and even run queries without providing any credit card information. It’s an excellent, risk-free way to get hands-on experience.
BigQuery Structure Explained
Understanding how BigQuery organizes things is key to using it effectively. It follows a clear hierarchy:
-
Project: This is the top-level organizing container within Google Cloud Platform (GCP). Think of it as your main workspace or account umbrella. A Project is associated with billing, manages permissions (who can do what), and enables Google Cloud APIs (like the BigQuery API itself). A single GCP Project can contain many different cloud resources, such as virtual machines, storage buckets, and your BigQuery datasets and tables. For your MDW, you’ll typically create or use a dedicated GCP Project.
-
Dataset: Residing within a Project, a Dataset is a grouping mechanism specifically for BigQuery tables, views, and other related resources. You can think of it like a database schema or a folder used to organize your tables logically. For instance, you might create separate Datasets for marketing_ads_data, website_analytics_data, crm_customer_data, etc. Datasets also serve as a boundary for controlling access – you can grant permissions to users or groups at the Dataset level. Importantly, each Dataset is created in a specific geographic location (e.g., US, EU, asia-northeast1), and your data physically resides in that location, which can be relevant for compliance and performance.
-
Table: This is where your actual data lives, structured into rows and columns, similar to a spreadsheet but far more powerful and scalable. Each Table sits inside a specific Dataset. A Table is defined by a schema, which dictates the names and data types (e.g.,
STRING,INTEGER,DATE,TIMESTAMP,FLOAT) of each column. BigQuery supports various table types, including native tables (where BigQuery manages the storage), external tables (where data resides in Google Cloud Storage or other sources), and views (virtual tables based on SQL queries). Your ETL/ELT processes will load data into these Tables.
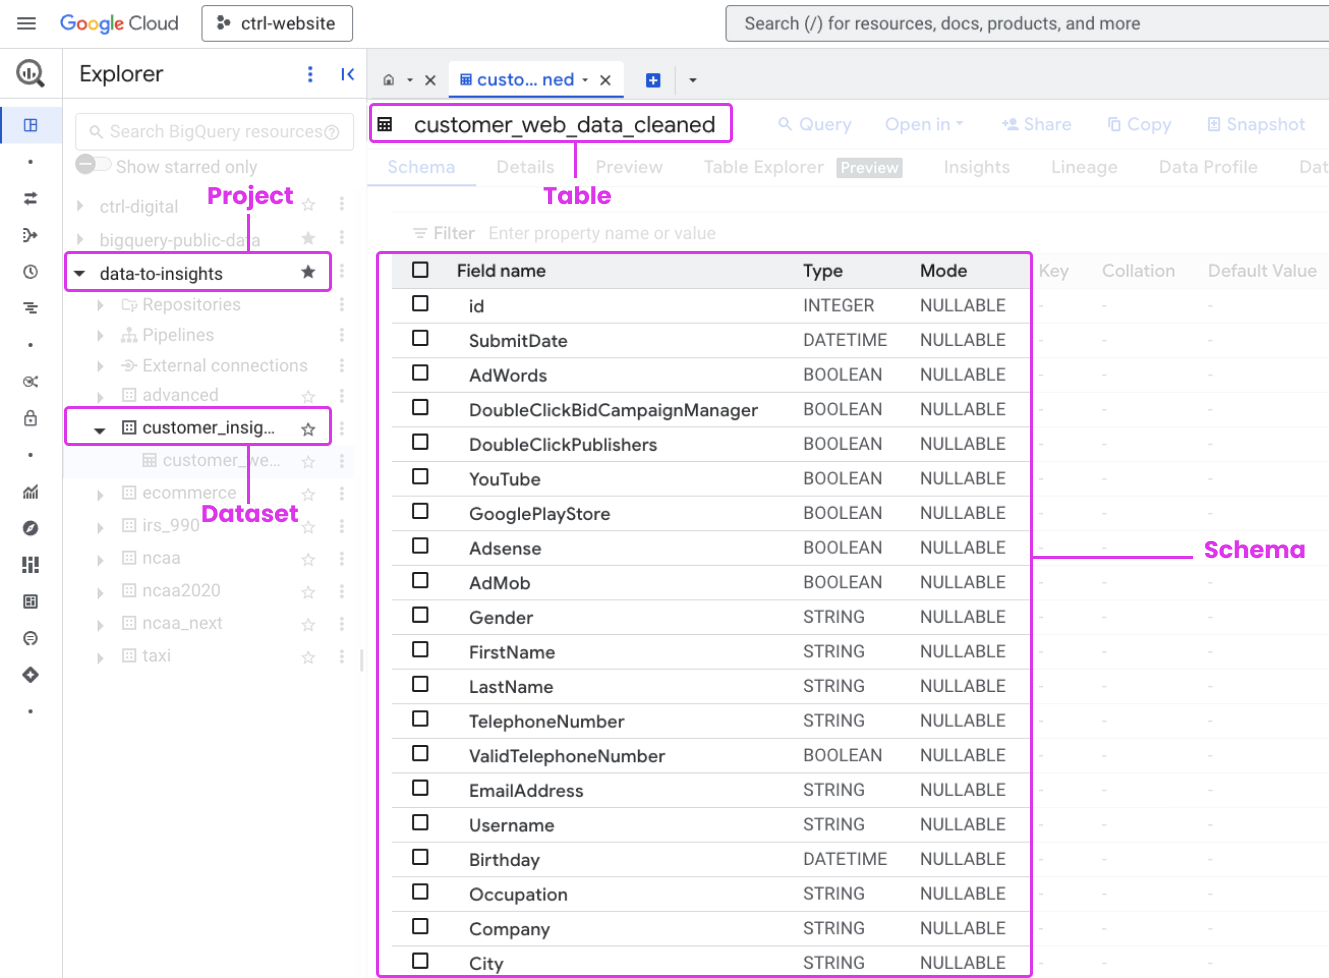
So, the hierarchy is straightforward: You work within a Project, organize your data containers into logical Datasets, and store your structured data within Tables inside those datasets. Understanding this structure helps in managing permissions, costs, and data organization as your warehouse grows.
Bringing Your Data to Life: Analysis & Activation
Once your cleaned, structured, and unified data is consistently flowing into your BigQuery Marketing Data Warehouse, the real potential is unlocked. This is where you move beyond data collection and start generating tangible business value:
Unified Reporting & Visualization: This is often the first and most immediate benefit. Connect your preferred Business Intelligence (BI) tool, Looker Studio is a natural fit with BigQuery, but Tableau, Power BI, Qlik, Metabase, and others work seamlessly - directly to your BigQuery tables. Build dynamic, automated dashboards that showcase performance across all channels using consistent definitions. Track key metrics like blended Cost Per Acquisition (CPA), Return On Ad Spend (ROAS) across platforms, visualize full-funnel conversion paths from initial touchpoint to final sale, and monitor budget pacing against performance targets, all in one place.
Deep Dive Analysis with SQL: Go beyond pre-defined dashboard metrics and ask sophisticated questions of your data using SQL. BigQuery’s powerful query engine allows you to slice, dice, aggregate, and join data across different tables and sources in ways impossible within siloed platforms. While mastering SQL takes time, basic queries for filtering, grouping, and summing data are relatively accessible.
Example Analysis: “Identify which campaigns drove users who viewed product pages X, Y, and Z but did not purchase, and compare their source channels.”
Example Analysis: “Calculate the average time lag between the first ad interaction and a customer’s first purchase, broken down by customer segment defined in the CRM.”
Example Analysis: “Compare the lifetime value (LTV) of customers acquired through Google Ads Search campaigns versus those acquired through Facebook Ads Prospecting campaigns.”
Advanced Analytics & Machine Learning: BigQuery integrates with Google Cloud’s AI Platform and offers built-in BigQuery ML capabilities. This allows more advanced teams to build predictive models directly on their warehouse data using SQL syntax. Examples include propensity modeling (predicting which users are likely to convert), customer churn prediction, LTV forecasting, or sophisticated budget allocation models.
Audience Segmentation & Activation: This transforms your data warehouse from a passive reporting tool into an active marketing engine. Use SQL queries to build highly specific audience segments based on combined behavioral, transactional, and demographic data from across your sources. For instance:
Users acquired via Campaign A, who visited the site 3+ times in the last 30 days, have items in their cart, but haven’t purchased.
Customers from CRM segment ‘VIP’ who haven’t engaged with an email or visited the site in 90 days.
You can then export these precise lists from BigQuery and upload them to your marketing platforms (e.g., Google Ads Customer Match, Facebook Custom Audiences, email marketing lists) for hyper-targeted advertising, re-engagement campaigns, personalized promotions, or suppression (excluding certain users from campaigns). This data-driven activation significantly improves marketing efficiency and relevance.
Ready to Unlock Your Marketing Data Superpowers?
Moving from the common state of scattered spreadsheets and siloed platform reports to a centralized Marketing Data Warehouse in Google BigQuery might seem like a significant undertaking, but the strategic benefits are transformative for any data-conscious marketing team. You gain:
- Clarity: A single, reliable source of truth for all marketing performance, eliminating conflicting numbers and “data debates.”
- Efficiency: Dramatically reduced time and manual effort spent on routine reporting and data aggregation, freeing up your team for higher-value analysis and strategy.
- Deeper Insights: The ability to perform truly cross-channel analysis, understand complex customer journeys, uncover historical trends, and answer strategic business questions that were previously impossible.
- Enhanced Actionability: The power to move beyond simple reporting and actively use your unified data to build sophisticated audience segments for targeted activation, personalization, and improved campaign performance.
Your Next Steps:
-
Explore Hands-On: Take advantage of the BigQuery Sandbox. Sign up with your Google account (no credit card needed initially) and start exploring the interface and public datasets available. This is the best way to get a feel for the environment risk-free.
-
Experiment with SQL: Run some basic SQL queries against the public datasets in the Sandbox. Search for “BigQuery public datasets tutorial” or “basic SQL for marketers.” Even simple
SELECT,WHERE, andGROUP BYcommands will start to build familiarity. -
Identify Quick Wins: Think about your biggest data pain points right now. Is it combining Facebook Ads and Google Ads spend and conversions? Is it linking website behavior to CRM data? Focusing on solving one or two high-impact problems first can provide momentum.
Stop drowning in data chaos and fragmented views. Start building your foundation for smarter, more efficient, and ultimately more impactful marketing with a Marketing Data Warehouse in Google BigQuery. The clarity, insights, and activation capabilities you unlock will fundamentally change how you operate and prove to be well worth the investment in time and resources.