Introduction to the Data Transfer for Google Analytics 4
Explore the new Google Analytics 4 Data Transfer to BigQuery – a free feature that gives you ready-made tables with your Google Analytics 4 data. It makes reporting faster, analysis easier, and data more accessible.
Google recently announced a new Data Transfer in BigQuery to get ready-made tables with data from Google Analytics 4. It’s a free service, and you only pay for storage in BigQuery and any subsequent SQL queries you run on the data.
Benefits of working with Google Analytics 4 data in BigQuery
Working with digital analytics data in BigQuery offers several benefits over using the Google Analytics 4 (GA4) user interface:
- Custom Reporting: BigQuery allows you to create custom reports and queries, whereas GA4 offers limited predefined reports.
- Flexibility: With BigQuery, you can access raw, unprocessed data, giving you more control over your analysis. GA4 only provides processed data.
- Scalability: BigQuery can handle large volumes of data more efficiently, making it easier to work with big datasets. GA4 can be slower and less flexible when dealing with large amounts of data.
- Advanced Analysis: BigQuery supports advanced analysis using SQL, enabling deeper insights. GA4 has fewer analysis tools compared to BigQuery.
- Data Integration: BigQuery allows you to integrate data from various sources, providing a more complete view of your analytics. GA4 is limited to the data within its system.
Let’s look at how to set up the new Data Transfer from Google Analytics 4, what tables are created, and what analysis you can do with the data in BigQuery.
Set up the Data Transfer for GA4
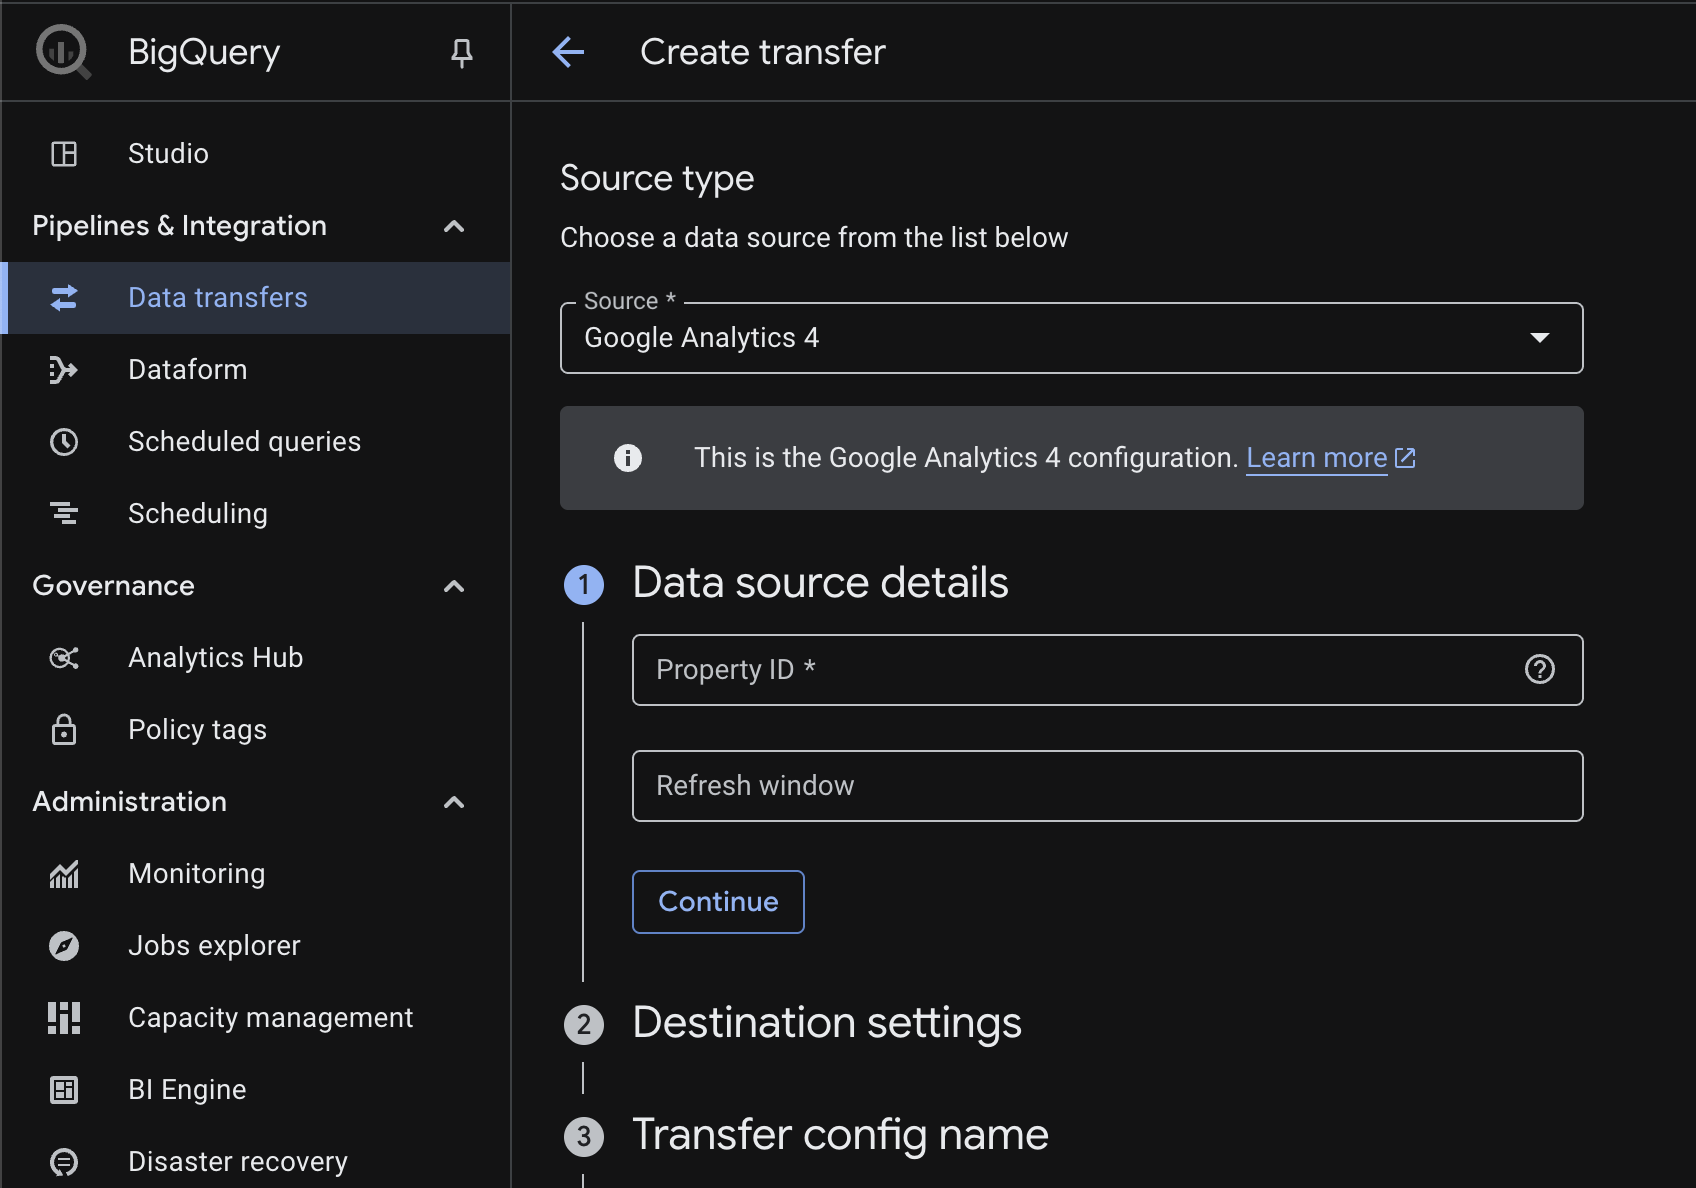
To start the transfer, go to the Data Transfers section in BigQuery Studio from the left menu. Then, click on “Create New Transfer” and select Google Analytics 4 from the dropdown menu.
There are seven simple steps to complete before you begin your Google Analytics 4 Data Transfer.
-
Data source details
Enter the PropertyID for the Google Analytics 4 property you want to export. You can find the PropertyID under Property Details in the Admin section, or in the property selector at the top of the Google Analytics 4 interface. You can leave the Refresh window blank; it will default to 4 days. -
Destination settings
Choose or create a new dataset where the tables will be created. You can name it something like “ga4_data_transfer.” If you plan to load data from several properties into the same BigQuery project, it might be helpful to include the PropertyID in the dataset name for easy identification. -
Transfer config name
Give this transfer a descriptive name, such as “ga4_data_transfer.” If you plan to load multiple properties into the same BigQuery project, it’s useful to include the PropertyID in the name for easier identification. -
Schedule options
Here you can set up the update schedule. You can leave it as is, but it’s best to set the Repeat Frequency to “Days.” This lets you decide at what time the data should be updated each day (preferably in the morning). Make sure you check the timezone. -
Service account
If you leave this blank, it will use your personal account in BigQuery. Make sure your account has access to the Google Analytics 4 property. It’s safer to set up a service account in Google Cloud Platform (GCP) with proper access for this transfer, as relying on your personal account is risky. If you lose access to either the property or the BigQuery project, the transfer will fail. -
Notification options
You can enable notifications when the transfer finishes. While email notifications might not be common, using Pub/Sub lets you trigger other actions, like running queries on the new data after it’s transferred. -
Advanced options
Leave the Encryption key as Google-managed encryption unless your organization uses a Custom Key Management Service (CKMS).
Start the Data Transfer
Once you’ve filled out all seven options, click Save, and an initial backfill will begin for a few dates.
In the top-right corner, you can edit and manage the transfer. The first thing you should do is trigger a backfill to import more dates. Click on “Schedule Backfill” and select the dates you want to import from your property. The transfer will start and process them one by one.
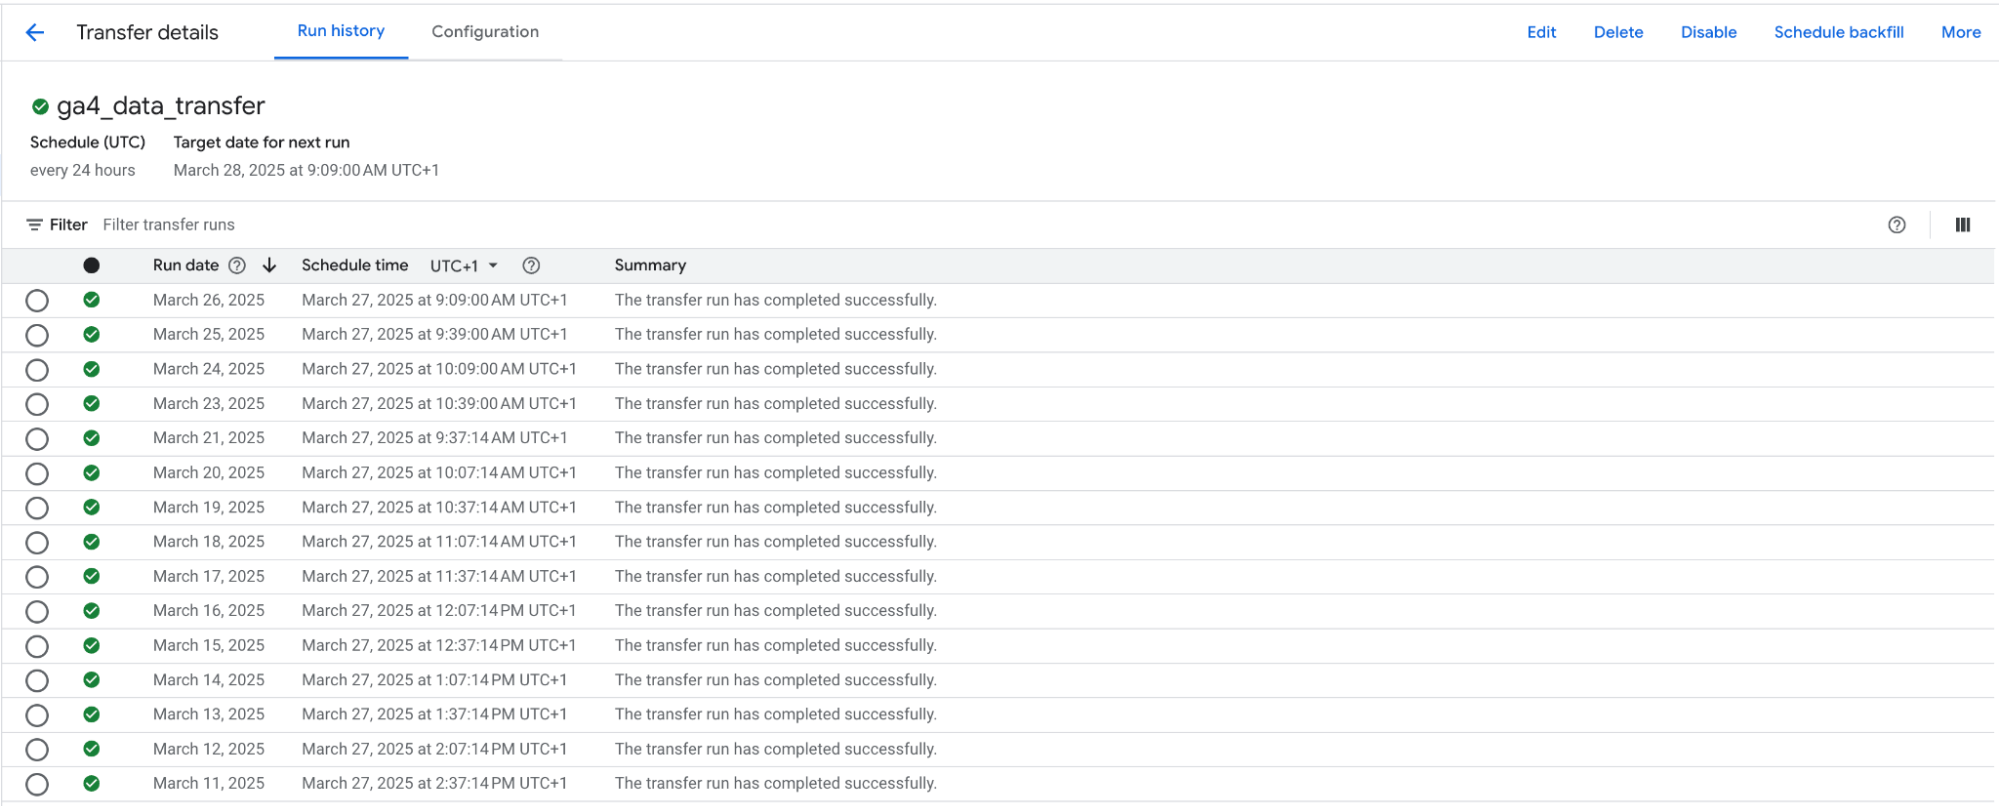
The Data Transfer for Google Analytics 4 and the jobs history.
The Google Analytics 4 Data Transfer creates two versions of each table. The first one, prefixed with p_, contains the raw data, while the second one, prefixed with ga4_, is a view that extracts the date from _PARTITIONTIME
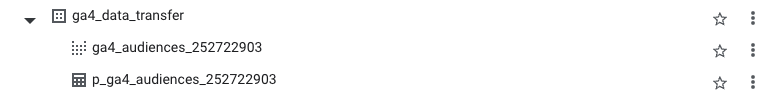
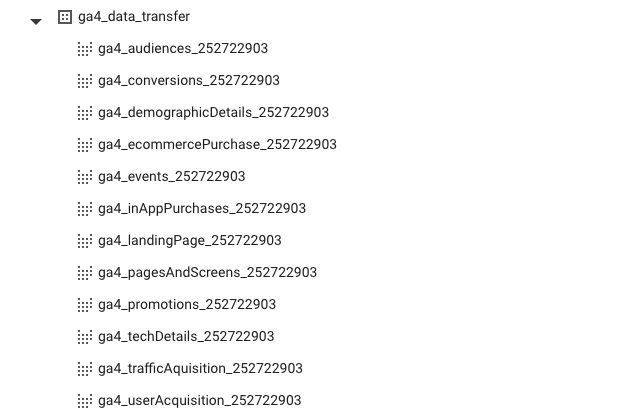
An example of the table and view created for the Audience report for the Google Analytics 4 property with ID 252722903.
For your queries, always use the ga4_ views.
The table names are the same as the reports in the GA4 interface they replicate. For example, the ga4_pageandscreens table corresponds to the Pages and Screens report in the Google Analytics 4 reporting interface.
The tables are ready to query!
The tables created by Google Analytics 4 Data Transfer
These are the tables and views that are loaded into BgiQuery. Further down in the article we will have an in-depth look at each and one of them.
Example querys for the tables created by the Google Analytics 4 Data Transfer
With the tables loaded into BigQuery, let´s look at two different query´s we can run using these tables.
Traffic Acquisition report
In our first query, we want to generate a simple Traffic Acquisition report and see which Channel Group drives sessions and conversions.
SELECT
  _DATA_DATE AS date,
  session_default_channel_group as channel,
  sessions,
  conversions
FROM
  `<project>.<dataset>.ga4_userAcquisition_<propertyID>`
ORDER BY
    _DATA_DATE DESC
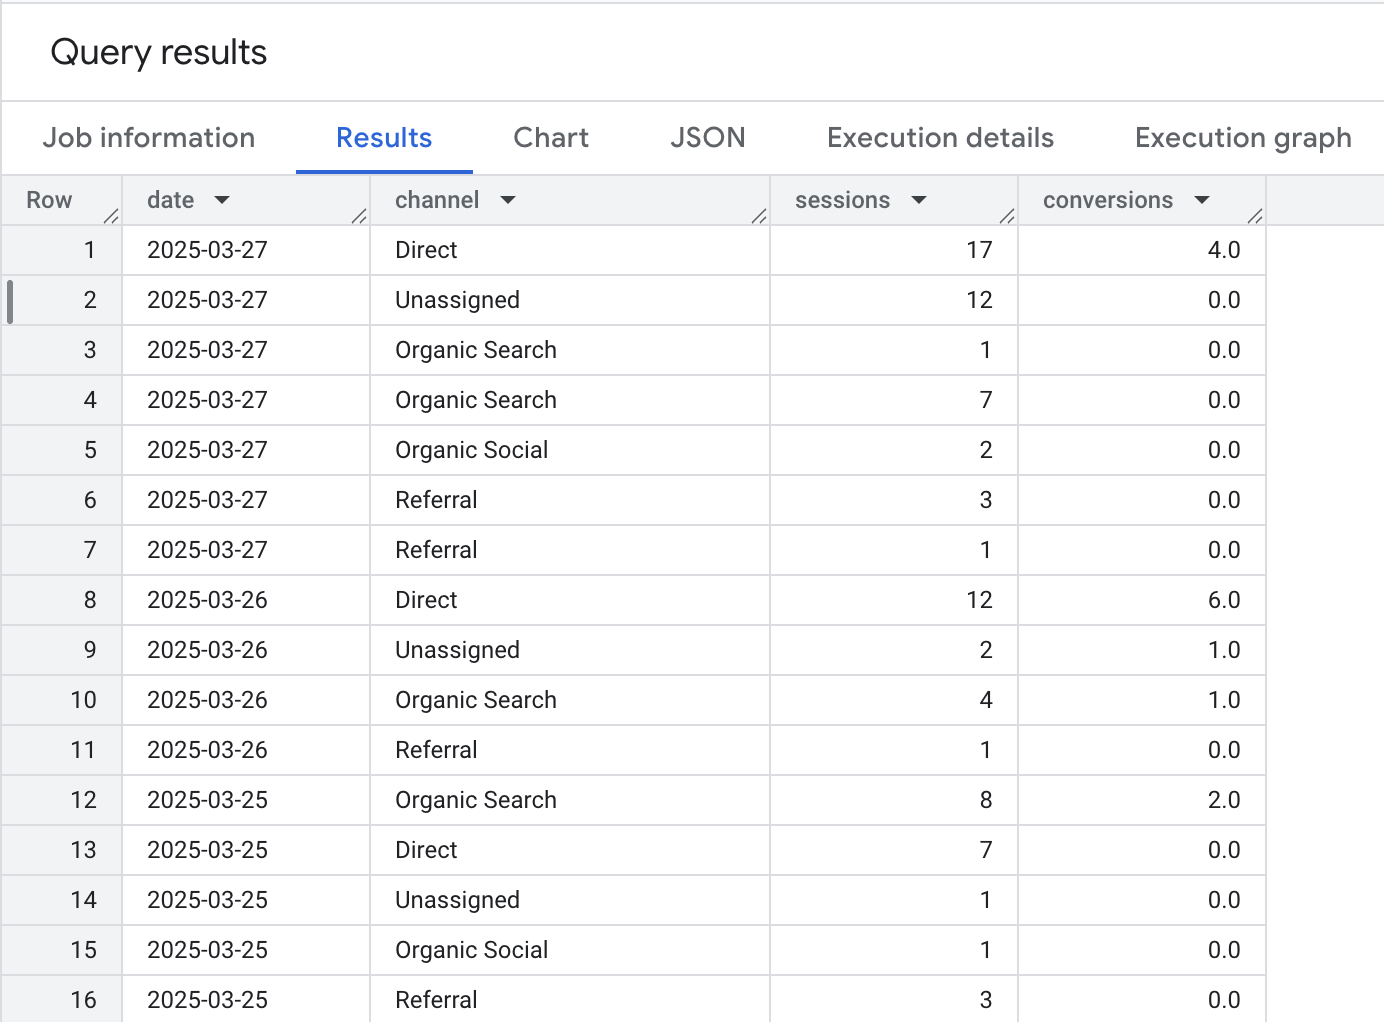
The result is a table that shows sessions and conversions per Channel Group and date.
Device category report
In our next query, we want to generate a simple Traffic Acquisition report and see which Channel Group drives sessions and conversions.
SELECT
  _DATA_DATE AS date,
  device_category,
  engaged_sessions
FROM
  `<project>.<dataset>.ga4_techDetails_<propertyID>`
ORDER BY
  _DATA_DATE desc
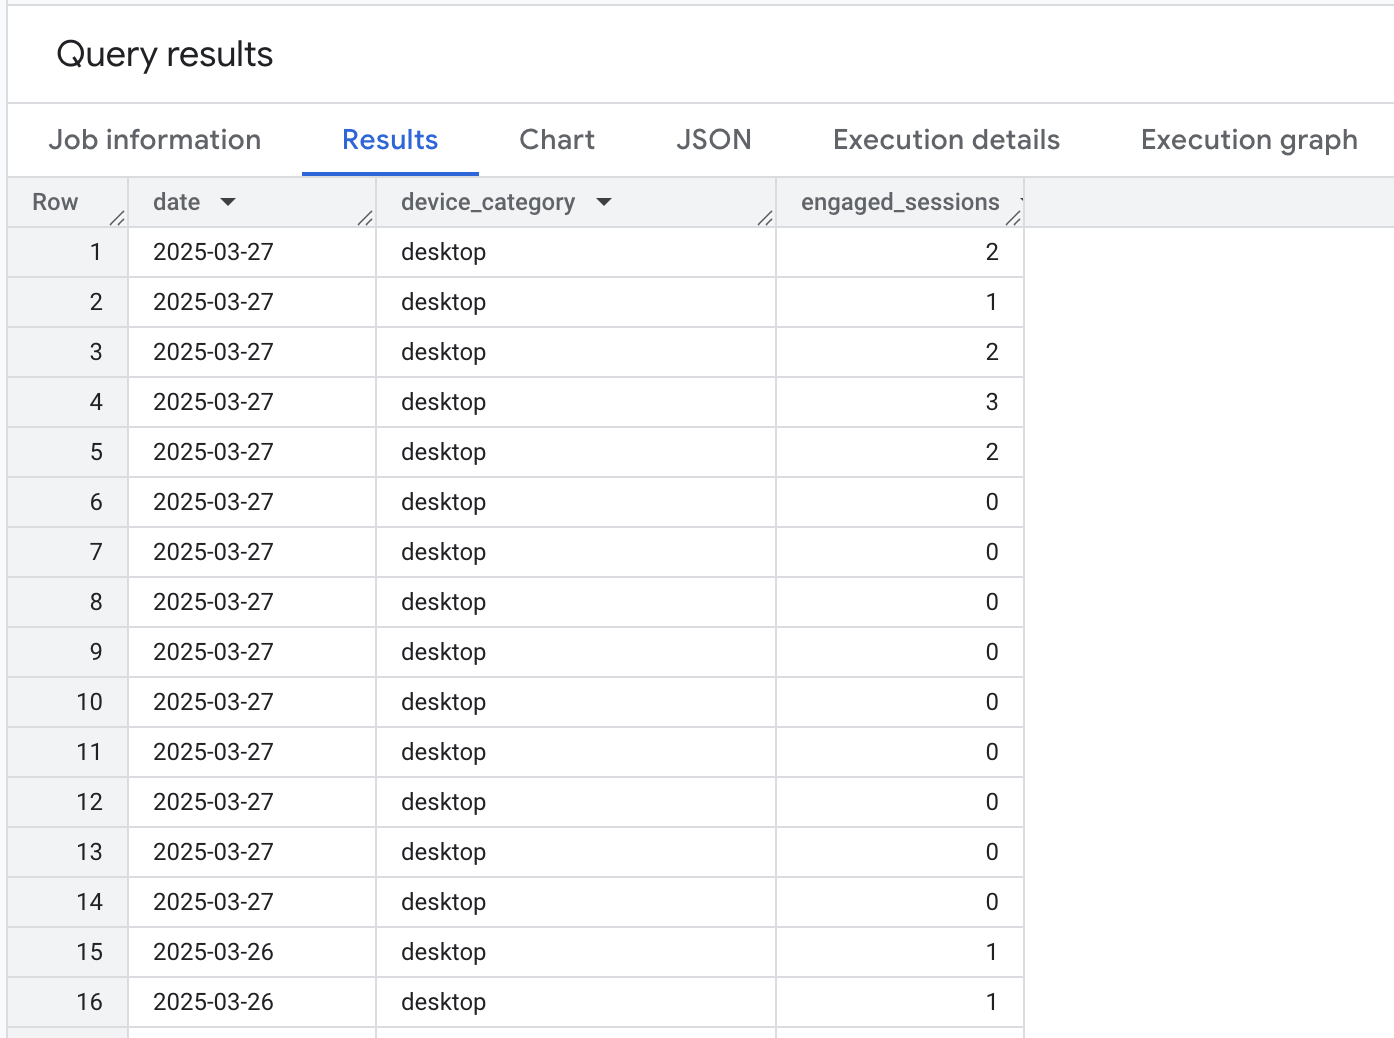
The result is a table that shows engaged session per device category and date.
Schema of the tables created by Google Analytics 4 Data Transfer
Lets have a look at all the different tables that are create by the Google Analytics 4 Data Transfer.
Audiences table
| Field | Descriptions |
|---|---|
| audience_name | The name of the audience users belong to (e.g., “Returning Users” or “High-Value Customers”). |
| average_session_duration | The average length of a session in seconds. |
| new_users | The number of users who visited your site or app for the first time. |
| sessions | The number of sessions started by users. |
| total_revenue | The total revenue generated from purchases or conversions. |
This table contains aggregated data by audience group from Google Analytics 4. It shows how different user segments perform in terms of traffic, engagement, and revenue. You can use this data to compare audience behavior, evaluate marketing strategies, and find high-performing or underperforming user segments.
Conversions table
| Field | Descriptions |
|---|---|
| event_name | The name of the event tracked in GA4 (e.g., purchase, add_to_cart, page_view). |
| conversions | The number of times the event counted as a key event. |
| total_revenue | The total revenue linked to the event, typically from purchases. Its displayed in millions, divide by 1000000. |
| total_users | The number of unique users who triggered the event. |
This table shows event-level performance in GA4. It connects user actions (events) to key outcomes like conversions and revenue. If the event was marked as a key event it will count as a conversion.
Demographic details table
| Field | Descriptions |
|---|---|
| branding_interest | A category of user interest related to branding or affinity (based on Google signals). |
| city | The city from which the user accessed your site or app. |
| country | The country of the user’s location. |
| language | The language setting of the user’s device or browser. |
| region | The region or state the user is located in. |
| user_age_bracket | The age range of the user (e.g., 18-24, 25-34). |
| user_gender | The gender of the user (e.g., male, female, or unknown). |
| conversions | The number of conversions from users in this demographic or location group. |
| engaged_sessions | Sessions that lasted longer than 10 seconds, had a conversion, or included at least 2 pageviews. |
| engagement_rate | The percentage of engaged sessions out of total sessions. |
| event_count | The total number of events triggered. |
| new_users | The number of first-time visitors in this group. (Based on first_open or first_visit) |
| total_revenue | The revenue generated by this segment of users. |
| user_engagement_duration | Total time users were actively engaging (in seconds). |
This table combines user demographics, location, and behavior data. It helps you analyze how different audience groups (by age, gender, interest, location) engage with your site or app. You can use this to tailor content, identify high-value segments, and improve targeting in marketing campaigns.
Ecommerce purchases table
| Field | Descriptions |
|---|---|
| item_brand | The brand name of the item. |
| item_category | The top-level category assigned to the item. |
| item_category2 | Second-level category of the item (more specific than item_category). |
| item_category3 | Third-level category for deeper categorization. |
| item_category4 | Fourth-level category. |
| item_category5 | Fifth-level category (most detailed level). |
| item_id | A unique identifier for the item (SKU or product ID). |
| item_name | The display name of the item. |
| item_variant | A variation of the item (e.g., size, color). |
| item_revenue | Revenue generated from this item. |
| items_added_to_cart | The number of times this item was added to a cart. |
| items_purchased | The number of times this item was purchased. |
This table contains product-level data from GA4 e-commerce events. It shows how individual items perform across categories and variants. You can use it to track product performance, understand customer preferences, and guide inventory or marketing decisions based on what sells or gets added to carts.
Events table
| Field | Descriptions |
|---|---|
| event_name | The name of the event tracked in GA4 (e.g., purchase, scroll, sign_up). |
| event_count | Total number of times this event occurred. |
| event_count_per_user | Average number of times each user triggered this event. |
| total_revenue | Total revenue attributed to this event. |
| total_users | Number of unique users who triggered this event. |
Very similar to the Conversion table. This table summarizes how each event statistics, both count, per user, eventual revenue and total users per event.
In-app purchases table
| Field | Descriptions |
|---|---|
| item_id | The unique ID for the item |
| item_revenue | Revenue from this item only, excluding tax and shipping. Calculated as item price × quantity. Its displayed in millions, divide by 1000000. |
| items_purchased | Number of units of this item that were purchased. |
This table focuses on individual item performance in purchase events. It helps you track which products generate the most revenue and how many units are sold. Useful for analyzing product sales, inventory planning, and evaluating item-level performance.
Landing page table
| Field | Descriptions |
|---|---|
| session_campaign_name | The name of the marketing campaign that brought the user (from UTM campaign). |
| session_default_channel_group | The standard channel grouping GA4 assigns to the session (e.g., Organic Search, Direct). |
| session_medium | The medium that describes how traffic arrived (e.g., organic, cpc, referral). |
| session_primary_channel_group | The customizable channel group applied to the session, if defined. |
| session_source | The source that referred the user (e.g., google, newsletter). |
| session_source_medium | Combined source and medium (e.g., google/organic). |
| session_source_platform | How the traffic source was acquired. Manual means UTM-tags, Google Ads means the information was fetched from Google Ads using gclid, (not set) means neither. |
| conversions | The number of conversions from users in these sessions. |
| new_users | Number of users who visited for the first time through this source. |
| sessions | Number of sessions started from this traffic source. |
| total_revenue | Total revenue from users who came through this source. Its displayed in millions, divide by 1000000. |
This table shows where your session came from, grouped by source, medium, campaign, and channel. It helps you understand the performance of marketing efforts, track which sources drive revenue and conversions, and compare acquisition strategies. It’s useful for traffic analysis, campaign tracking, and marketing ROI. But one thing, to note, even do it is named Landing Page report, it lacks any information about the landing page, making it more of a traffic acquisition report.
Pages and screens table
| Field | Descriptions |
|---|---|
| content_group | A group of related pages or screens defined in GA4 to organize content (e.g., “Product Pages”). |
| unified_page_path_screen | The full path of the webpage or screen the user viewed. |
| unified_screen_class | The app screen class name (mainly for app tracking). |
| unified_screen_name | The title or name of the screen or page. |
| conversions | The number of conversions that happened on this page or screen. |
| event_count | Total number of events triggered on this page or screen. |
| screen_page_views | Number of times the page or screen was viewed (event count). |
| screen_page_views_per_user | Average number of views per user. |
| total_revenue | Total revenue generated from this page or screen. Its displayed in millions, divide by 1000000. |
| user_engagement_duration | Total time users actively engaged with the page or screen (in seconds). |
This table gives insights into how users interact with different pages (URLs) or screens. It includes views, events, revenue, and engagement data.
Tech details table
| Field | Descriptions |
|---|---|
| app_version | The version of the app installed (e.g., 1.5.0 for Android or iOS). |
| device_category | Type of device: Desktop, Tablet, or Mobile. |
| device_model | Model of the user’s mobile device (e.g., iPhone 10,6). |
| operating_system | The OS used by the user (e.g., Android, iOS, Windows). |
| operating_system_version | The version number of the OS (e.g., 13.5.1). |
| operating_system_with_version | Combined name and version of the OS (e.g., Android 10). |
| platform | Platform used: web, iOS, or Android. |
| platform_device_category | Combined platform and device type (e.g., Android / mobile). |
| screen_resolution | Screen resolution of the user’s device (e.g., 1920x1080). |
| conversions | Number of conversions from users on this device/platform setup. |
| engaged_sessions | Number of sessions that were considered engaged (over 10s, had 2+ pageviews, or a conversion). |
| engagement_rate | Share of sessions that were engaged (as a decimal, e.g., 0.72). |
| event_count | Total number of events triggered on this device/platform. |
| new_users | Number of first-time users on this platform/device. |
| total_revenue | Total revenue from users on this setup, minus refunds. Its displayed in millions, divide by 1000000. |
| user_engagement_duration | Time spent actively engaging with the site or app (in seconds). |
This table gives insights into how users on different platforms and devices interact with your site or app. It includes device details, operating systems, screen info, and engagement metrics.
Traffic Acquisition table
Note: There is two tables acquisition, Traffic and User. But it appears that the “User” table is session-scoped and the “Traffic” table is user-scoped.
| Field | Descriptions |
|---|---|
| first_user_campaign_name | Name of the campaign that first brought the user (e.g., a Google Ads or manual UTM campaign). |
| first_user_default_channel_group | The default channel group for the user’s first session (e.g., Organic Search, Direct, Email). |
| first_user_google_ads_ad_group_name | The Google Ads ad group name that first acquired the user. |
| first_user_google_ads_ad_network_type | The type of Google ad network used to acquire the user (e.g., Search, Display, YouTube). |
| first_user_medium | The traffic medium that first brought the user (e.g., organic, cpc, referral). |
| first_user_primary_channel_group | The custom or updated primary channel group for the first user session. |
| first_user_source | The source that first brought the user (e.g., google, newsletter). |
| first_user_source_medium | Combined source and medium for the user’s first session (e.g., google/organic). |
| first_user_source_platform | Platform that first acquired the user (e.g., Google Ads, Facebook). |
| conversions | Number of conversions from users based on their acquisition source. |
| engaged_sessions | Number of engaged sessions from those users. |
| engagement_rate | Share of engaged sessions among total sessions (as a decimal). |
| event_count | Total number of events triggered by these users. |
| new_users | Users who interacted with the site/app for the first time. |
| sessions_per_user | Average number of sessions per user. |
| total_revenue | Revenue (Purchase revenue plus Subscription revenue plus Ad revenue) generated from users based on their original acquisition. Its displayed in millions, divide by 1000000. |
| user_engagement_duration | Time users actively engaged with the site/app (in seconds). |
This table shows how users were first acquired, including campaign, channel, and ad details. It links acquisition data to behavior and outcomes like conversions and revenue.
User Acquisition table
| Field | Descriptions |
|---|---|
| session_campaign_name | The campaign name linked to the session (e.g., Google Ads or UTM campaign). |
| session_default_channel_group | GA4’s standard channel group for the session (e.g., Organic Search, Direct, Email). |
| session_medium | The medium that led to the session (e.g., organic, cpc, referral). |
| session_primary_channel_group | The primary channel group used in reporting, based on your property’s channel setup. |
| session_source | The source of the session (e.g., google, facebook.com). |
| session_source_medium | Combined source and medium (e.g., google/organic). |
| session_source_platform | How the traffic source was acquired. Manual means UTM-tags, Google Ads means the information was fetched from Google Ads using gclid, (not set) means neither. |
| conversions | Number of conversions during the session. |
| engaged_sessions | Number of sessions that were considered engaged (10+ seconds, a conversion, or 2+ pageviews). |
| engagement_rate | Percentage of sessions that were engaged (e.g., 0.72 = 72%). |
| event_count | Total number of events triggered in the session. |
| events_per_session | Average number of events per session. |
| sessions | Total sessions, based on session_start events. |
| sessions_per_user | Average sessions per user. |
| total_revenue | Revenue (Purchase revenue plus Subscription revenue plus Ad revenue) during the session, minus refunds. Its displayed in millions, divide by 1000000. |
This table provides a breakdown of traffic sources at the session level. It links acquisition details like campaign, source, and medium with user behavior and business outcomes such as events, conversions, and revenue.
The differences between this data transfer and the “old” GA4 event export to BigQuery.
The big difference compared to the old event-based export to BigQuery is that this new data transfer is aggregated and not as granular. This means we don’t have the same ability to combine and calculate data as we would like.
Therefore, there will likely be a benefit in using both exports for different needs and analyses within a business.
Summary
The easy ways to load data between different systems are always helpful, whether you’re loading data into BigQuery or out. As of now, there are still some bugs, but hopefully, they will be fixed soon. After that, this will be a great addition to your toolbox for digital analytics.
One big advantage is that the tables follow the same definitions as the graphs and tables in the Google Analytics 4 interface, which makes things easier. Since they are pre-calculated and aggregated around the right dimensions with familiar terminology, it’s easy for even beginners to start their first queries and analyses in BigQuery.
If you want to explore hosting your own GA4 backfill pipeline solution, Ctrl Digital has developed its own open source transfer solution that lets you configure and run a similar export yourself. This Python script fetches data from Google Analytics 4 using the Google Analytics Data API and inserts it into Google BigQuery. You can also backfill data for any date range.
Check it out at https://github.com/ctrl-digital/ga4-bigquery-backfill.
Happy data backfilling!